Explainable AI for Algae Blooms
By Mathew Titus
Introduction
Perhaps the largest barrier to implementing AI technologies in the utility management space is justifying the use of results that do not originate with human managers. Accountability to the public is fundamental for water providers, meaning they are subject to a great deal of regulation and scrutiny - and rightly so. Because of this, they cannot outsource their decision making around water safety to inscrutable and novel machine learning models.
On the other hand, algal blooms are an emerging threat to drinking water due to their ability to create toxic and malodorous compounds, clog filtration systems at water treatment plants, and form hypoxic “dead zones” in waterbodies. The large variety of algal species and their varied responses to environmental conditions, which also form a complex web of interactions, make predicting harmful algal activity a real challenge, and a moving target. This paired with the relatively recent access to high-fidelity and low-latency data gathering mean that the problem is ripe for an artificial intelligence solution.
Many lakes now can gather distributed data (e.g. remote sensing images), targeted genetic data (e.g. RNA qPCR), real-time hydrological data (such as USGS streamgage info), and multi-modal lake conditions (dissolved matter, pigment concentrations, physicochemical state, etc.) across depth from sonde measurements. Even nutrient conditions can be collected with a short turn-around time. This information is collected at no small expense to watershed managers, but then must often be collated and analyzed by hand in order to tease out potential warning signals of oncoming blooms. In short, the problem remains unsolved, but AI solutions are often too cryptic to be incorporated into a solution.
The Proposal
To combat this, collaborators at Carollo Engineers and my company ClearWater Analytica applied for a research grant in 2021. The Water Research Foundation (WRF) put out an RFP (request for proposal) on large-scale solutions for understanding and anticipating cyanobacterial blooms. Our proposal became WRF Project #5080, and involved over two dozen utility collaborators.
We suggested a partner-oriented approach, where multiple utilities would share their data and watershed information with us, and we would use that information to build a library of predictive models that could then be applied across a variety of watersheds. (This would work by essentially matching new waterbodies to models trained on data from other locations that shared key features.) These models would be ensemble models, meaning that each is built from a number of “base learners,” each a model in its own right (decision trees, here).
Crucially, the models trained would be human-interpretable, and display the actual data points that influenced the model to create the prediction. This way, a human user can interrogate the model and see what the machine deemed as important as it trained an intricate and automatic model. If the domain expert suspects certain data points as being unreliable, or certain relationships among the variables as being coincidental, they can discount the contributions from those data points or from specific base learner models. In this way, the human operator can use AI tools to parse a large, complex dataset, interrogate the machine’s reasoning, and then refine and modify the model output to create a defensible AI-based algal bloom prediction.
The Tool
Parsing, interpreting, and importing our partnered utilities’ data accounted for easily half of the work of the project. We’ll skip over all of that.
Given a refined dataframe, holding a subselection of the waterbody’s data (e.g. nutrient and sonde measurements) we performed an 80/20 training-test split, and trained an AdaBoost model with decision tree base learners to predict the 7- or 14-day maximum cyanobacterial cell count for the waterbody. That is, using environmental information up to day \(t\), the model would iteratively train regression decision trees to predict \(\max_{1 \leq s \leq 7}(C_{t+s})\) using a boosting algorithm, where \(C_t\) is the logarithm of the cyanobacteria cell count on day \(t\). The trained model was validated on the test data held out, and its performance on that data determined its relative impact in the final “metamodel”.
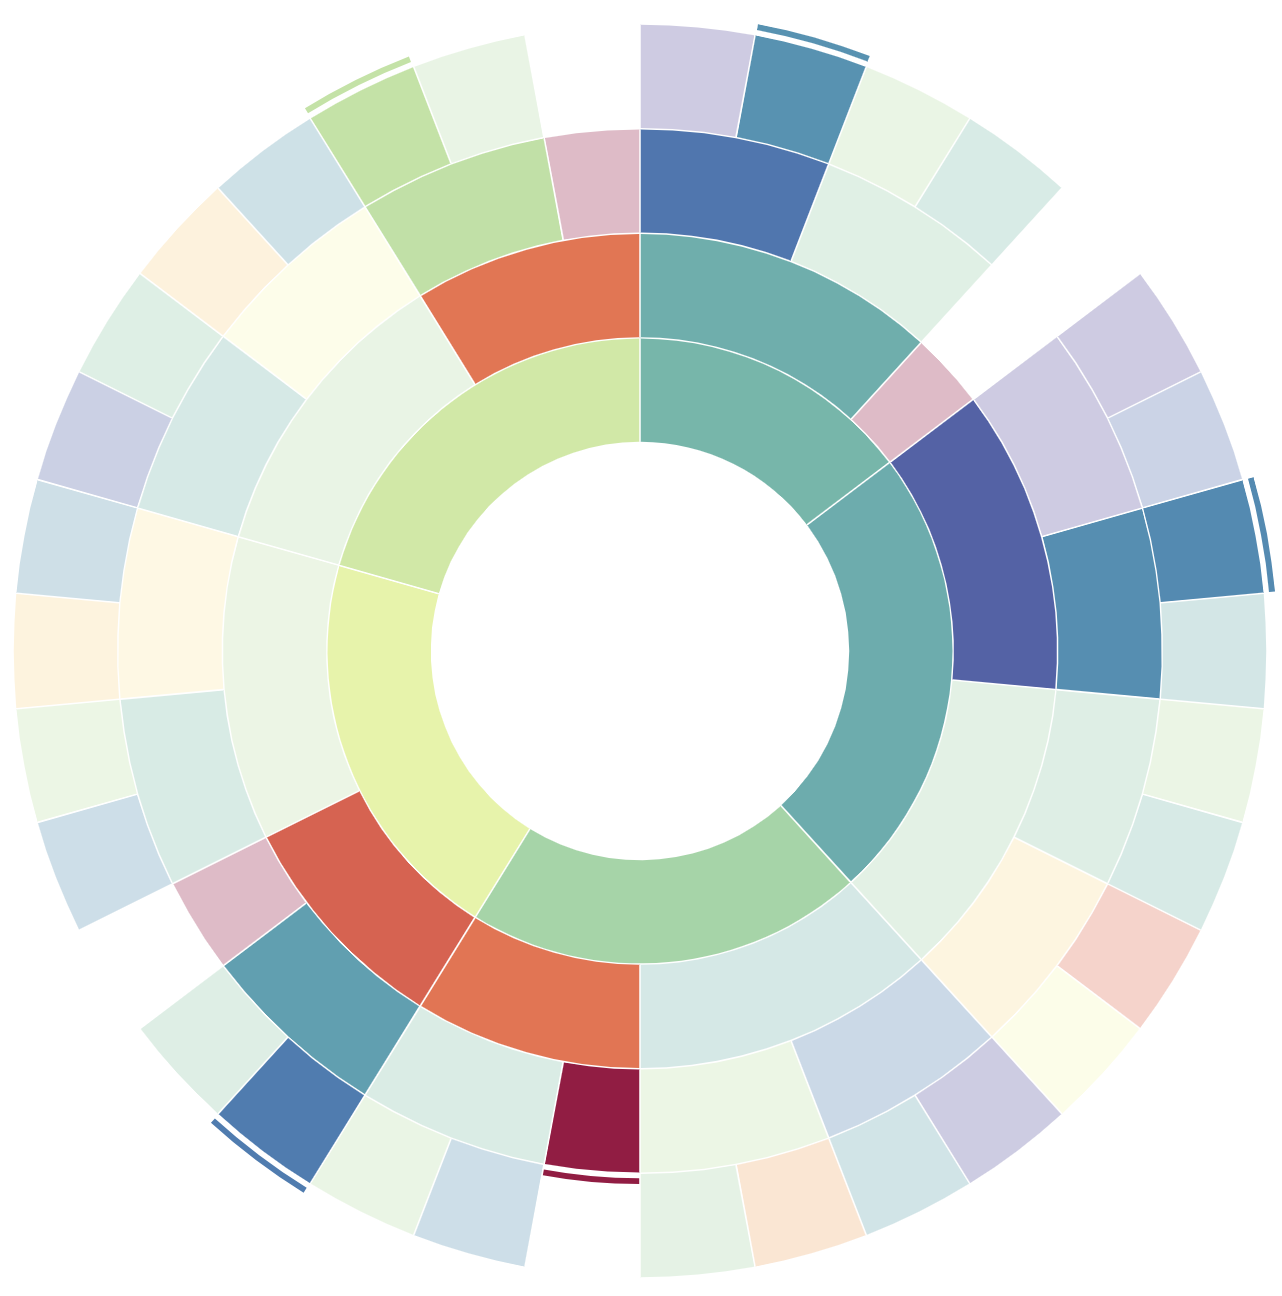
The result is (for each waterbody) an ensemble model associated to each combination of variables, such as weather and nutrients, or sonde data and algae population data. Each ensemble model is a sequence of decision trees, which can be nicely plotted as binary trees. By arranging these trees in a circle with their roots oriented towards the center and their leaves arranged along the outside diameter, we get a visual summary of the entire ensemble model.
 An example display of the ensemble model as a sunburst plot. Each arc is a node of a decision tree. There are five trees arranged around the sunburst; their roots form the innermost ring of the plot. Each arc either has two child arcs (adjacent, one ring outward) or is a leaf arc. Each leaf arc has an associated prediction, and each model will have one active (opaque) leaf, corresponding to the model’s prediction.
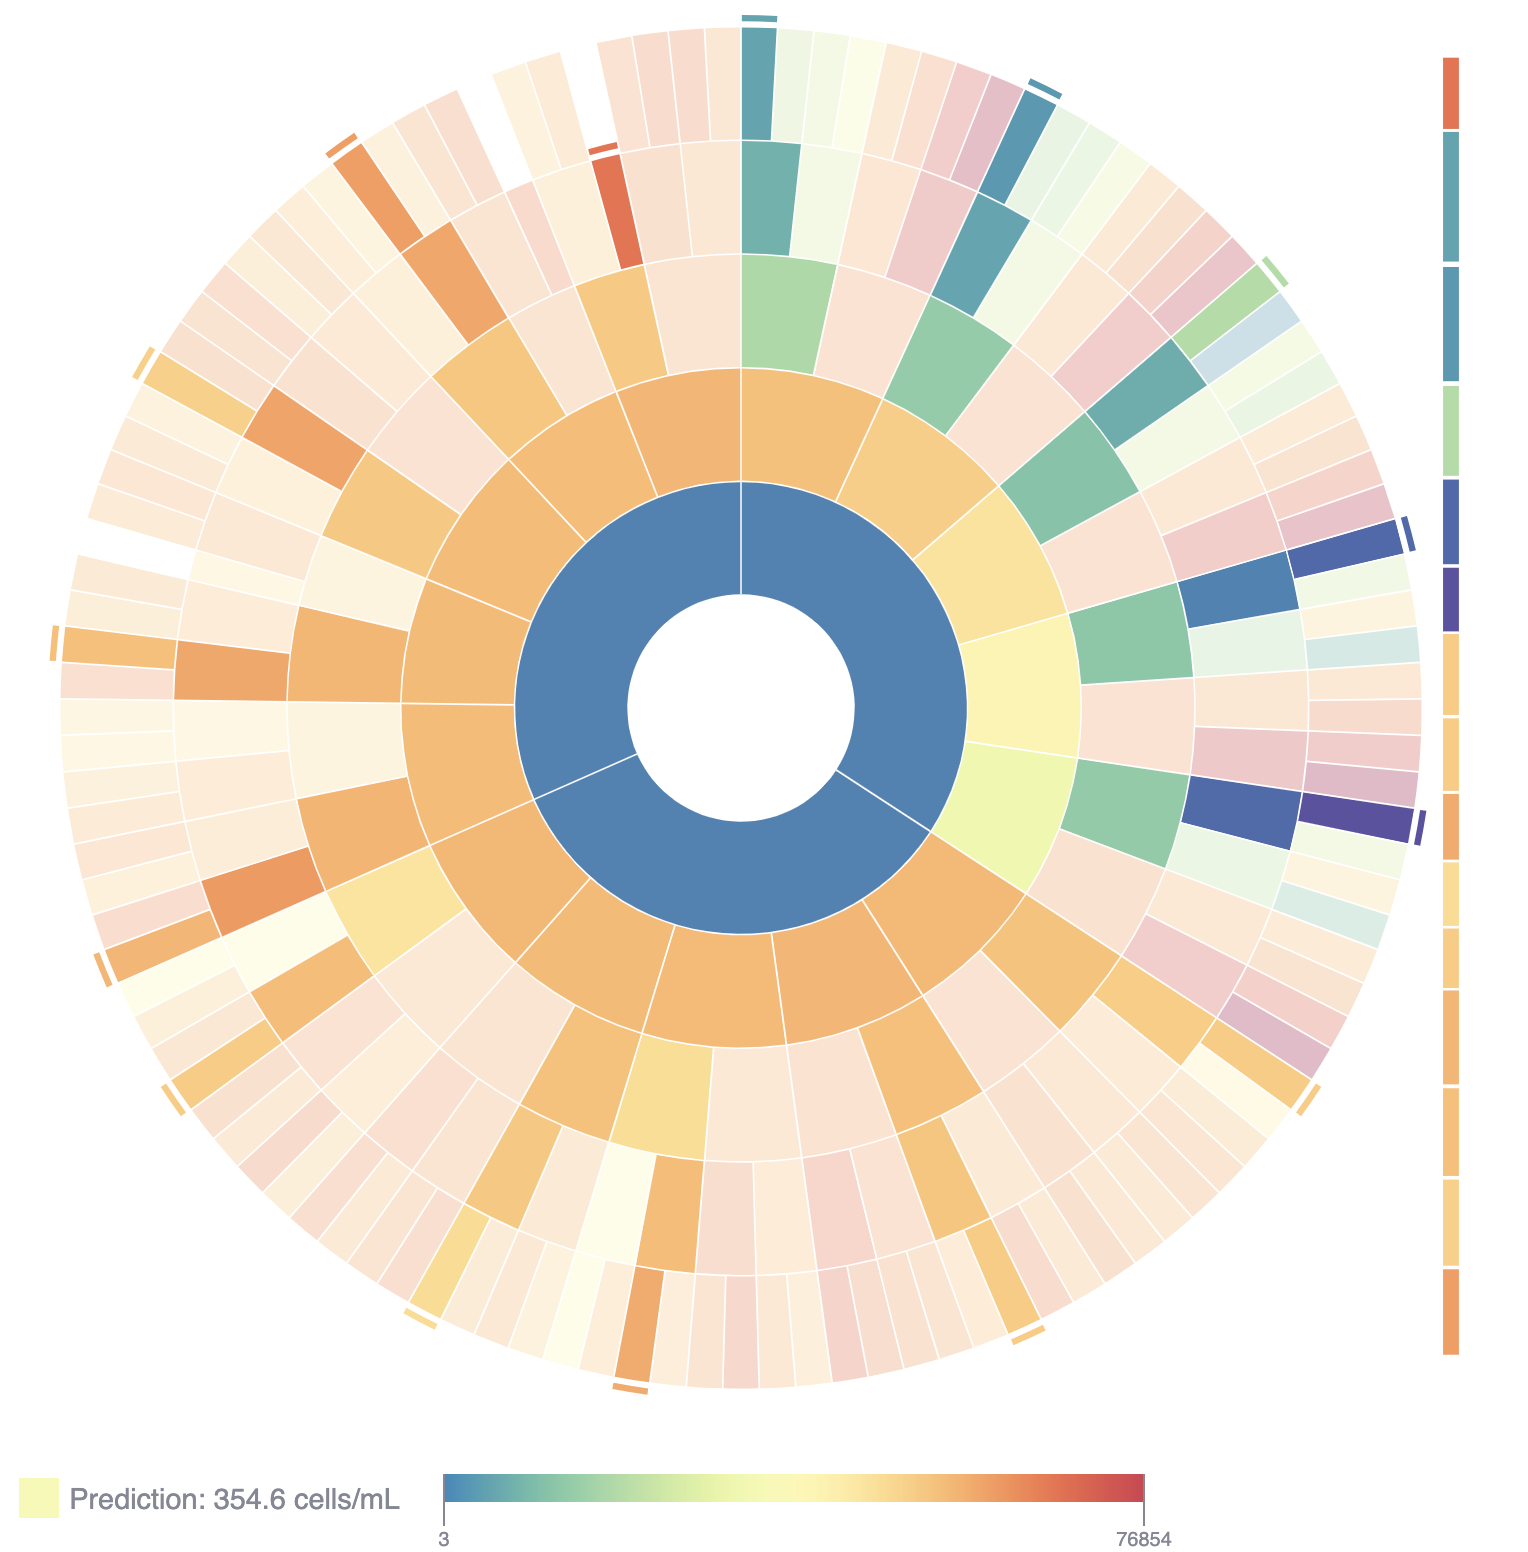
Given the variety of data combinations, each leading to more or less informative predictors and more or less concurrent data to train on, we formulated a large number of reasonable ensemble models. With a bias for performance but also diversity of input data, we created what you could call a “meta-ensemble” model: a collection of ensemble models whose outputs go into a weighted averaged to give a final point estimate for \(\max_{1\leq s\leq7} C_{t+s} \). The result is pictured below; to interact with the metamodel itself, click here.
The webtool linked above has a number of ways to explore the model outputs.
- The prediction for the selected input conditions is displayed in the lower left. Hovering over the innermost ring will show what data was used in the ensemble model and its \(R^2\) score.
- The user can also look at the Algal Bloom Drivers section to see which variables were most informative for the prediction.
- Selecting an arc of the sunburst plot, the Independent Variables section shows the current value of the associated variable, as well as the partial dependence of the cyanobacteria count on that variable. Clicking this plot, the user can update the current value of the variable.
- Since each internal arc corresponds to a branch point in a decision tree, each has a variable and a threshold value associated to it. Clicking on the arc, you can navigate to the Rule Explanations tab to see the data that were incorporated in training that “decision” for the arc selected.
I should note that not every model predicts cyanobacteria levels; some waterbodies were not amenable to this and so we predict phycocyanin concentrations instead.
It also bears underlining that this tool is a proof of concept. We were able to create predictive AI models using multiple modes of data, and display the output in an interpretable manner. If a watershed manager opens the tool they can see the specific past data that has led to the metamodel’s prediction of the future. However, a number of improvements would really bring this tool to life:
- Ideally, we would allow the operator to make decisions about the trustworthiness of each arc in the model and prune it accordingly.
- New data should be able to be prepped and uploaded as a new source of information, populating new branches of the sunburst plot to be reviewed and incorporated.
- The point prediction could be replaced with the distribution of predictions, rather than a simple average. This would allow the operator to see how much consensus exists among the models, and more easily spot strong/weak constituents.
- The independent variables should be more easily navigated, and their set values should be more easily updated to allow the model to be incorporated into daily operations.
